So you’ve discovered a useful playbook that is just right for automating the task you have in mind but you need to tweak it just a bit. Or you are feeling ambitious and writing your playbook from scratch. Perhaps you’ve inherited a massive playbook with lots of nested sub-playbooks and it has stopped working. Well, if any of these scenarios fits you, then we’ve got a great solution for you —the Cortex XSOAR playbook debugger.
In fact, our own XSOAR development team uses the debugger to test new automation scripts.I recently caught up with Ido Van Dijk, Security Architect for Cortex XSOAR, and asked him about his experience using the playbook debugger.
How are you using the Cortex XSOAR Debugger?
I use it when I am just making small changes to a certain task. I can just run a particular task and check the output, skipping all the irrelevant tasks. This is helpful if the playbook is more complex, with multiple tasks and nested playbooks. I can catch any mistakes early by running just one or two tasks, basically isolating actions to specific parts of the playbook.
Why did the XSOAR dev team build it?
This complements our XSOAR visual playbook editor nicely. It helps you customize our automation playbooks easily. And it also simplifies it if you are creating it from scratch. While we offer hundreds of playbooks out of the box, we also understand that you probably have to tweak these playbooks to suit your needs. And playbooks can be hard to debug especially the more complicated ones. You have to follow the sequence of actions to ensure any changes you made are not impacting the output. With the debugger, you can test these changes in real-time as you make them and ensure the output values are as intended. It speeds up your debugging process by allowing you to just test specific tasks or the tasks you changed.
How does the Cortex XSOAR Debugger work?
The debugger is interactive and integrated into your editor. For complex playbooks, you can set a breakpoint so the playbook stops at the precise spot you are troubleshooting. The debugger allows you to change the values that the playbook uses as it runs. So if you are trying to understand what happens with a specific value as a result of an incident or integration, you can easily modify it and continue running the playbook or jump to another spot and change the value multiple times to test outcomes. You can also test conditional trees.
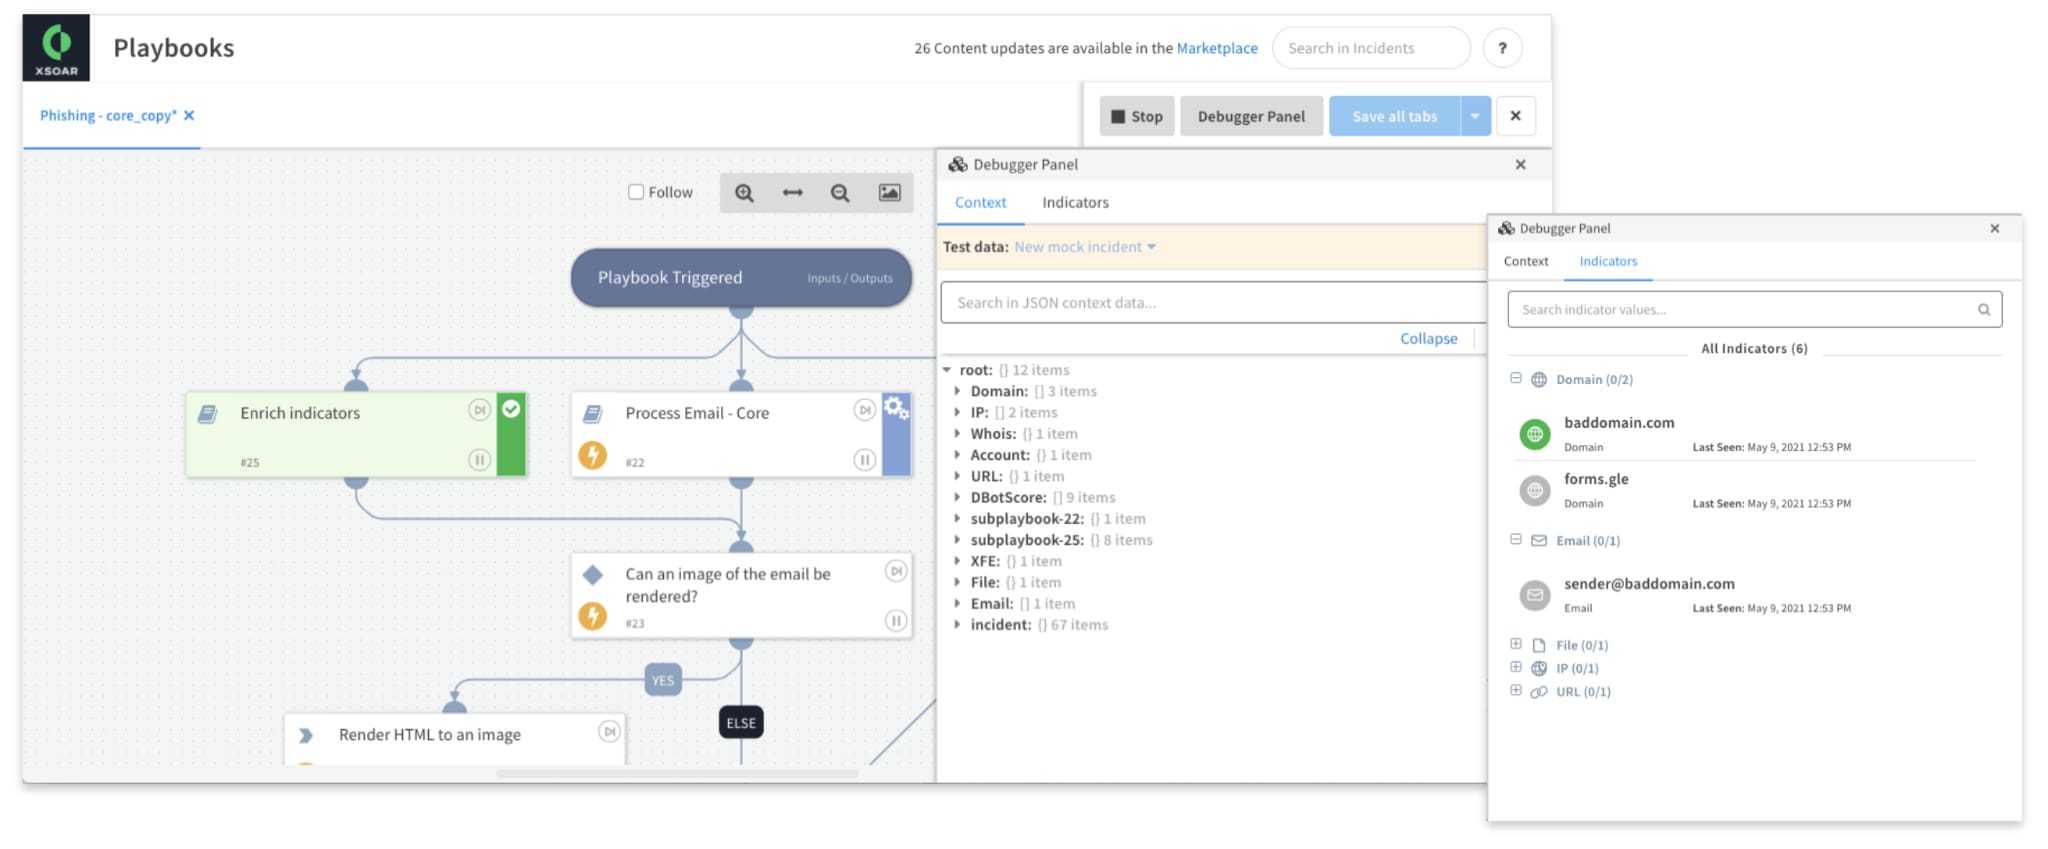
Quick and easy debugging, right from the Playbook Builder
For example, in the Phishing playbook, you can test to see if file detonation works as intended when you throw the file into a sandbox. Or you can test to see if the playbook is pulling the right user details from Active Directory. Another example could be if you are using a playbook to deliver a cool html email, and you make changes to the html, you could just test the notification output.
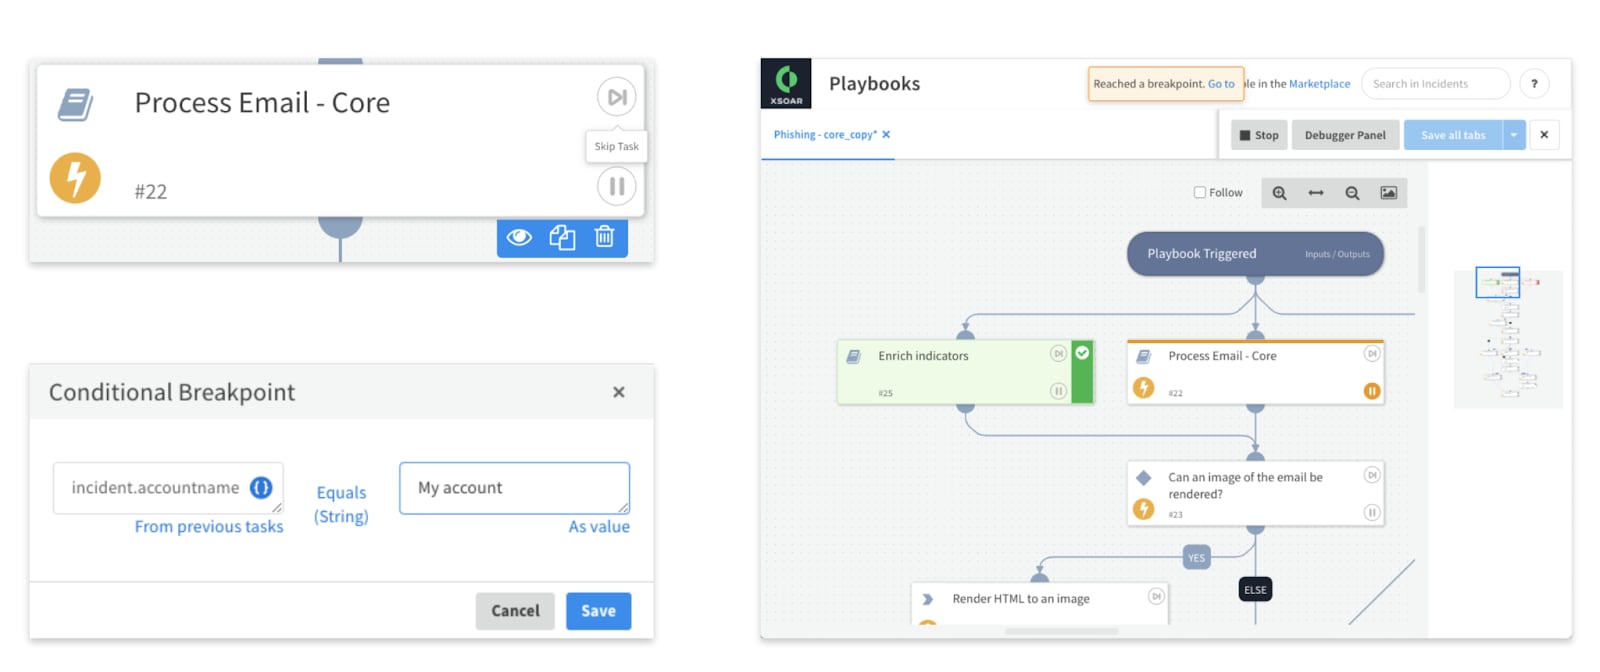
Skip tasks, add breakpoints and conditional tasks
A quick note about the Playbook Editor, with release 6.2, you can now edit multiple playbooks at the same time and copy and paste tasks between tabs.
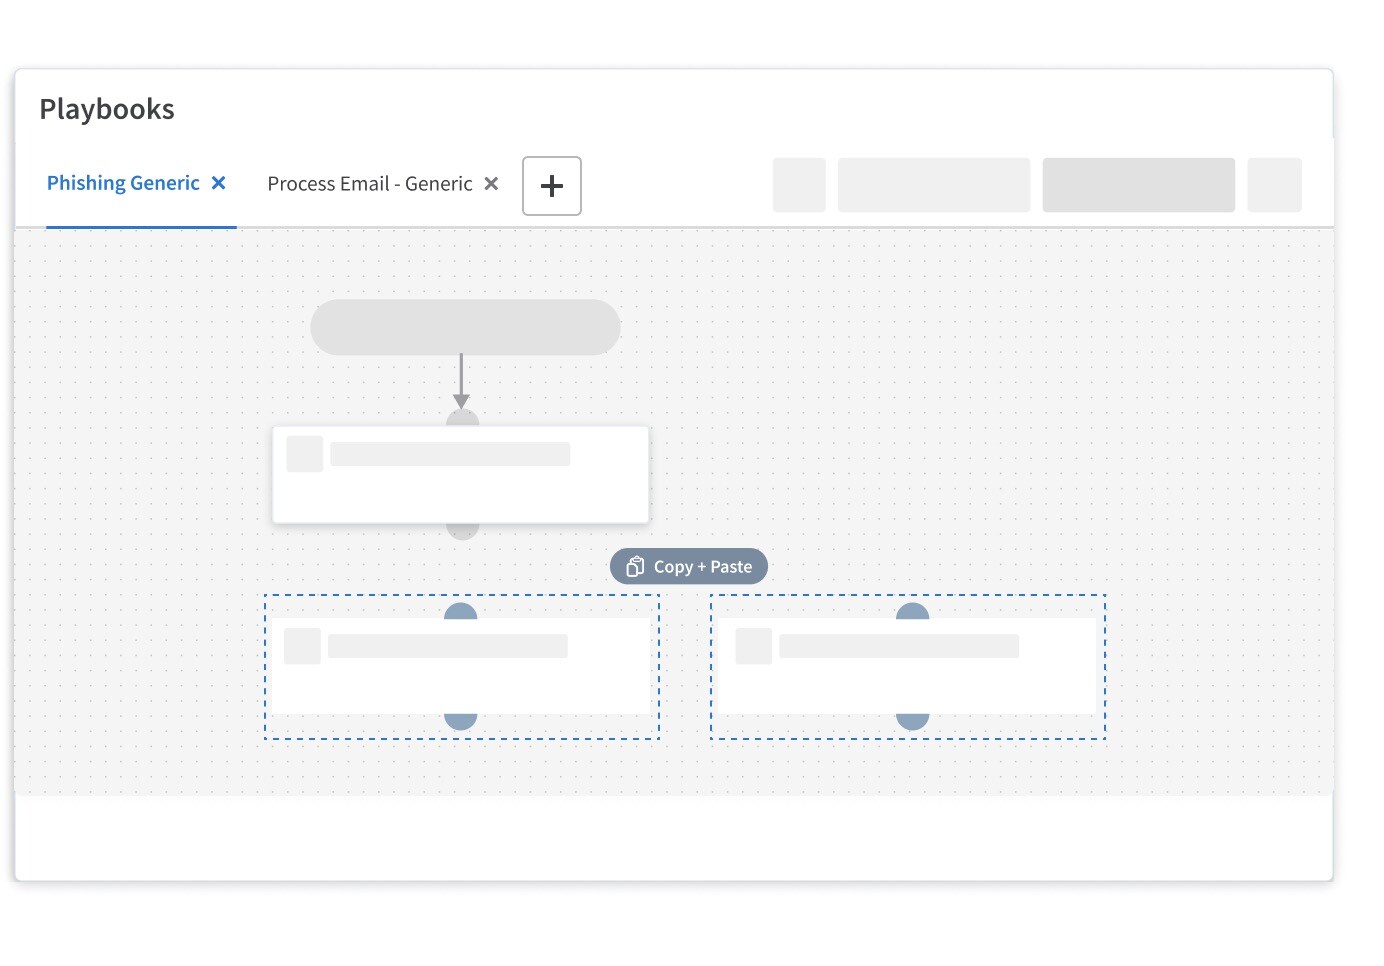
Batch editing of playbooks
Can anyone use it?
Yes, it’s available with Cortex XSOAR release 6.2 and enhancements have been made with each release since then. You can find more details on how the playbook debugger works in the Cortex XSOAR’s Administrator’s Guide.
Check out this cool feature by downloading your own copy of the Community Edition 30-day Free Trial.