Why connecting custom telemetry to operational context matters for AI-driven investigations
When an application starts behaving unexpectedly, on-call engineers have plenty of telemetry to investigate. They can examine request latency, error rates, resource utilization, and service dependencies to understand if there is a problem and where it is. But often the most useful clues to identify “what the problem is” come from the custom telemetry the engineering teams created themselves.
Consider a payment service that begins rejecting legitimate transactions after a configuration change. A sudden spike in HTTP 4xx errors might initially lead investigators to suspect a malformed request or unexpected client behavior. But a custom metric tracking payment validation failures reveals that the errors are concentrated in the application’s validation process, pointing investigators toward a potential issue in the business logic rather than the clients making the request.
This scenario illustrates a common challenge. Standard telemetry provides valuable insights into application and infrastructure health, while custom telemetry can reveal business-specific processes and technical behavior that standard instrumentation doesn’t. Without that context, identifying the cause of an incident can take longer. As AI takes on a greater role in incident response, the ability to understand and use custom telemetry becomes increasingly important.
Why custom telemetry presents a challenge for AI
Most observability platforms rely heavily on standardized instrumentation to discover services, understand dependencies, and populate application monitoring views and power alerting. This works well for telemetry that follows established conventions, whether collected through proprietary agents or open standards such as OpenTelemetry.
Engineers create custom telemetry to monitor the technical processes and business-specific operations that matter to their organizations. In our experience, custom telemetry can account for 50% or more of an organization’s total telemetry volume.
While observability platforms can ingest and query custom telemetry, they often struggle to associate it with relevant services and infrastructure. As a result, engineers have traditionally relied on custom dashboards to monitor and alert on this data, along with tribal knowledge to interpret and manually correlate it with other signals during an incident.
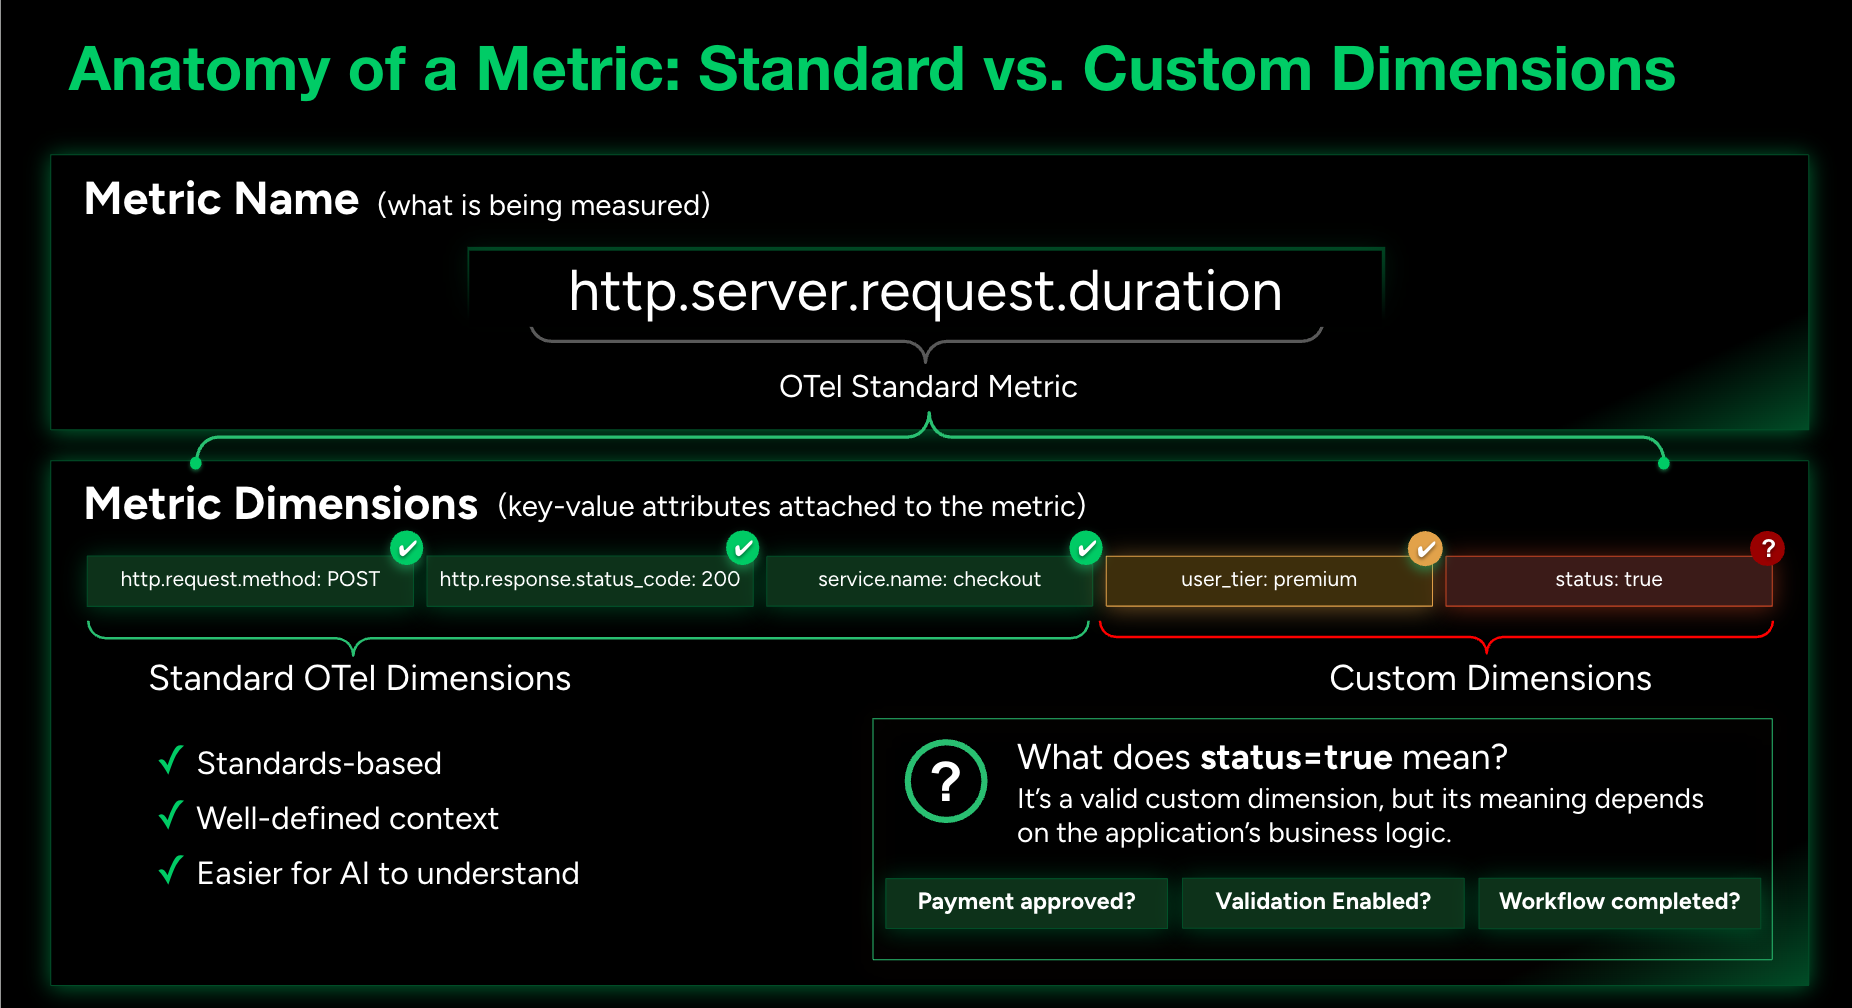
AI models are becoming increasingly capable of interpreting standard telemetry, in part because specifications like OpenTelemetry and common instrumentation patterns are publicly documented. But custom telemetry presents a different challenge. The meaning of organization-specific telemetry is often tied to internal business logic and systems that aren’t represented in an LLM’s training data. Without access to that context, even sophisticated AI models may struggle to understand what these measurements mean or how they relate to an incident.
This makes operational context especially important for autonomous AI root cause analysis. Knowledge graphs can represent relationships between telemetry, services, infrastructure, and other operational information, helping AI interpret unfamiliar signals within the broader environment. But, when custom telemetry isn’t understood or connected to the relevant services and infrastructure, important context may be missing from the knowledge graph. As a result, AI must reason with a more limited understanding of the environment, potentially making it harder to identify the root cause.
Bringing custom telemetry into the investigation with Cortex XCOR
Cortex XCOR is designed to work with heterogeneous telemetry, including custom data that doesn’t follow standardized instrumentation conventions. XCOR uses AI to interpret custom metrics and generate descriptions of what they measure, while normalizing the telemetry and associating it with the relevant services and infrastructure. This allows custom telemetry to become part of the broader operational context rather than leaving it as isolated data, unlikely to be used.
That context is important for autonomous investigations. By incorporating the meaning of custom telemetry and its relationship to services and infrastructure in Cortex XCOR’s knowledge graph, our AI SRE agent can evaluate those signals alongside other evidence when developing and testing root-cause hypotheses. In our payment service example, the agent would evaluate the spike in validation failures alongside service health, dependencies, and other available signals to narrow the investigation and focus attention on the affected application logic.
For human responders, XCOR’s extensible Service Views automatically bring custom telemetry together with standard application and infrastructure signals in a single contextual view. This allows engineers to investigate issues without switching between disconnected dashboards or manually correlating related data. XCOR also indexes custom metrics using AI-generated descriptions, enabling engineers to ask questions through XCOR Operator without knowing the exact metric names.
Better context, more effective investigations
Reducing Mean Time to Resolution (MTTR) depends heavily on how quickly teams can identify what’s causing an incident. By understanding custom telemetry and its relationships to the broader operational environment, XCOR’s AI SRE agent can evaluate more relevant signals and narrow down potential root causes faster. For human responders, making that same context available within XCOR’s Service Views reduces time spent locating and correlating information.
As AI accelerates software development and the pace of change in production environments, autonomous AI investigations will become the primary means of identifying root causes. But their effectiveness will depend on more than the sophistication of the AI model. The ability to interpret custom telemetry and connect it to the broader operational environment will be essential to effective AI-driven incident response.