The Application Usage and Threat Report provides an analysis of applications and their link to cyber threats within the enterprise. Our research is based on application traffic from more than 5,500 organizations, with 2,100 applications, 16,000 unique threats and billions of threat logs analyzed. It's clearer than ever that the relationship between cyberattacks and applications in use by businesses is inextricable.
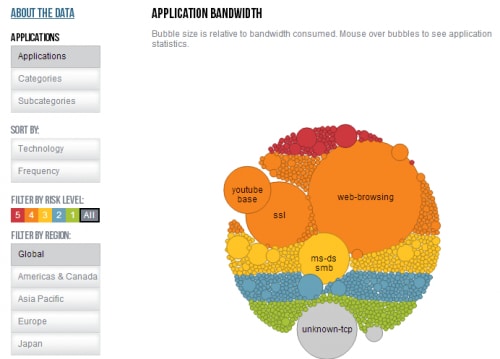
In addition to downloading the 2014 Application Usage and Threat Report in full, we invite you to interactively browse the data we gathered using our AUTR visualization tool. It's here where you can view what we've gathered by application, category and subcategory as well as sort it by technology and frequency, filter it by risk level, and filter it by region, including specific analyses for global usage, the Americas and Canada, the Asia Pacific region, Europe, and Japan.
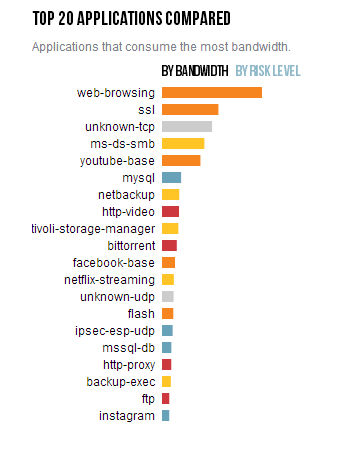
You'll also notice a comparison of the top 20 types of applications used by enterprises, including how much bandwidth they consume and what their risk level is.
What surprises you about this year's Application Usage and Threat Report data? Leave a comment and let us know what you think.